Risk Wire: Corporate Debt to GDP – Should We Worry?

In recent years there have been increasing concerns over corporate debt build-up in the US and Europe. Debt levels are considered high IF they cannot be sustained – in our assessment, a difficult claim to make for US and European companies.


The marked increase in the stock (volume) of corporate debt both in developed and emerging markets, particularly in comparison to the GDP levels, has triggered a concern over the balance sheets of the corporate sector and the build-up of financial risks.
Indeed, the total debt dynamic for instance in the US appears unsustainable, reaching ~73% of GDP in 2019 (Figure 1). Debt to GDP in European countries has reached 130-140% of GDP, up 10-25 percentage points compared to the 2008 levels.

However, there is a common misconception that higher debt levels automatically translate into riskier business or worse balance sheet. If this were the case, there would be a direct relationship between the level of debt adjusted for the economy (GDP) and the interest rate, which reflects the riskiness of debt…

Run Economic and Geo-political Scenarios

Explore how Agent-Based Models (ABMs) can be used to run stress tests and scenario analyses.

Counterparty Risk: When CDS Spreads and Ratings Are Not Enough

As the recent Deutsche Bank episode illustrates, counterparty risk management for pension funds and insurance companies should be based on more proactive and comprehensive assessment of all risks relating to the counterparty. Many Boards and investment committees, undoubtedly, have revisited their exposure to Deutsche Bank at some point during the episode and have had to make a quick decision (one way or another) based on limited amount of information. Such a decision would have been made easier with information beyond credit ratings, CDS spreads and rumours.
The situation is of course more complex than a few numbers can suggest: on the one hand, most major counterparty banks have extremely complex balance sheets, with off-balance-sheet exposures significantly more important than what is on the balance sheet. Based on our assessment of major counterparty banks, on the average, assets recorded on the balance sheet are only 65% of all assets that can be traced to the banks. This is possible through the use of special vehicles (SIV, SPE, VIE etc.). Furthermore, due to the so-called Master Netting Agreements, only a small proportion (~ 0.05%) of the total notional value of derivatives is actually included in the balance sheet. All of this creates huge uncertainty, which is not resolved by the politicized and commercial nature of credit ratings.
On the other hand, many banks, and not least Deutsche Bank, constitute a systemically important part of the global financial flows and as such will not only attract greater scrutiny from the regulators but also greater willingness to bail out in case of distress. Certainly the ability and willingness of the government to bail out banks has an implication for the credit risk. But not all home-governments are equally well-off to be able to afford such a rescue. So how does one reconcile all of these factors when dynamically assessing limits to counterparty exposures? Just how risky was the Deutsche Bank episode and what can be done to manage the risks in the future?

To take the example of Deutsche Bank, assessing the extent of the risk as the news flow arrived would have been easier with the insight of what is not on the bank’s balance sheet. Along with all the other major investment banks, Deutsche Bank has a significant derivatives exposure. Based on their 2015 annual report, the notional value of these derivatives is a little below Eur 42 trillion. Large part of this exposure (Eur 32.9 trillion) is in interest rate swaps. To be clear, the bank’s economic exposure is a fraction of this value – only about Eur 20 billion, or about 0.06%. A non-event then?
Not quite. The intricate mechanism of cash (or equivalent) collateral is in place to manage the counterparty risk of all the parties involved. One side of a trade in such a case is usually a pension fund or insurance company hedging its liabilities, while the other side – a hedge fund or bank. When for whatever reason there is distress in the market, such as the one we saw for Deutsche Bank (DB), trades that are unwound in one direction (in case of DB reportedly by a number of hedge funds) are likely to create quite a bit larger open exposure. What is more troubling, if interest rates begin to climb, as they do in these circumstances, there will be a large need for cash collateral from the side that gains, while the side that loses might fail to deliver the required collateral, thus exposing DB.
Judging by unaffected EONIA and LIBOR spreads, however, there is still little cause for panic. A number of factors help mitigate the specific risk. First, Deutsche Bank happens to be in the second group of G-SIB banks (Global Systemically Important Banks), a list that explicitly flags to the governments which banks cannot be left to sort themselves out. Second, the sustainability gap of Germany’s debt is a positive 1.5% (source: LINKS Counterparty Risk Assessment) – one of the few governments able to arrest any negative development, although the size of the (hypothetical) rescue is a whopping 5.3% of GDP.
Having these numbers at hand makes discussion on active management of counterparty risks more tangible and productive; as always, being prepared is the first line of defence.

Counterparty Risk

Find out more about LINKS Counterparty Risk Assessment data: comprehensive, flexible, cost-effective.

Five Trends Shaping Long-Term Asset Returns

Lower savings rate, structurally high unemployment, reversing globalization, over-regulation and volatile energy prices define the future of asset prices and returns. Equities will enter a period of stagnant returns, while interest rates will remain low-negative.
Over the past decade there has been a seismic shift in the willingness, ability and the mandate of investment professionals to have a view. The age of exchange-traded and index funds, algorithmic trading and benchmarks promotes lack of accountability. Some of this is understandable: far too many managers have fallen prey to marketing back-test lines printed on glossy paper promising good returns in any environment.
But when all is said and done, every morning, on the daily basis, our clients “reinvest” billions of euros of public money along some predefined benchmark, algorithm or allocation that is often based on a set of assumptions that have built-in opinions. Indeed, the crucial realisation is that a benchmark or an allocation mechanism, far from representing the market portfolio in the sense of modern portfolio theory, is just a view constructed and expressed by benchmark providers, and no more scientifically sound than a view of the Board of trustees.
As a minimum then, the view that is built into the allocation should be broadly aligned with the reasonable expectations of the managers involved. It is our belief that an institution should maintain and constantly update a sort of repository of core beliefs – a set of assumptions that nearly everyone in the investment team agrees should hold true going forward. This issue of Risk Wire crystallises our in-house collection of views. The key assumptions backed by what plausible arguments are fed into the Graham Risk framework, which then produces a consistent set of buy-and-hold and risk-adjusted return expectations by asset class. Many of these assumptions have been described in detail in our first issue of 2016 Risk Wire, others have been introduced during the year. In this issue we extend these assumptions and arrive at return estimates for all major asset classes, including credits.

Key observations: the world as we see it

In a number of critical ways the environment for all financial assets is going to be considerably different in the future compared to the last three decades. This is largely because of a number of observable social and economic trends. In this issue we have limited our list of “mega-trends” to five without implying that the list is exhaustive.
An important point here is that this is not a long list of things that should generally worry investors. The choice of these factors is an outcome of extensive research, trial and error process of simultaneously estimating asset returns for multiple asset classes; the drivers selected here have a documented, strong and proven impact on returns of one or more key asset classes.
The drivers in no particular order are:

  • Aging population saves less
  • Structurally high unemployment rates are here to stay
  • Reversing globalization
  • Changes in regulation severely limit profitability of companies
  • Energy prices will recover

It is immediately evident that all of the factors above have a negative flavour. This is not by design: we are on the lookout for any major trend, however, with the global economy struggling to achieve half of the growth rates that were common in the past, it is no surprise that what we find is the evidence of a strong headwind.

Aging population

The trend

Extrapolating today’s demographic trends in Europe and the U.S. a decade forward yields massive changes in the structure of the society. The population grows older and as a result saves less. One of the ways to look at the population age is the number of non-working age people relative to the total population. The ratios change significantly in the next decade.

Europe US
2014 34.1% 37.7%
2030 38.8% 41.7%


Why does this matter?

Savings is one of the key drivers of investments in equities. In fact, the savings rate is one of the few macroeconomic variables that is directly and strongly correlated with equity risk premiums.

 
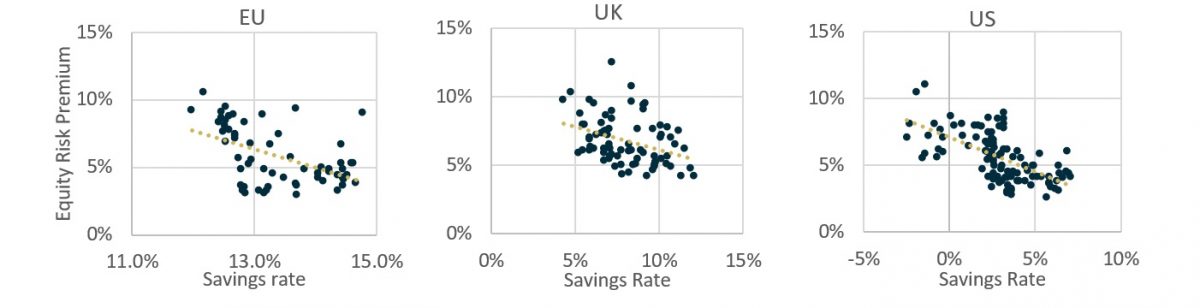
As you can see the relationship is negative: high savings rate means there is excess capital available to be invested in risky asset classes, so more capital chases limited investment opportunities and drives the price up and the equity risk premium (ERP) – down. The reverse is true too: lower savings rate means that there is smaller pool of capital supporting equity prices. For each percentage point increase in the proportion of non-working population the savings rate declines by 0.4%. In the next 15 years the average savings rate will be ~1% lower, which means ERPs will have to be up to 1% higher.

Change in the rate of non-employment age Change in savings due to aging Change in fair ERP
Europe 2.3% -1.0% 0.9%
US 2.0% -0.8% 0.2%

The difference between the impact in the U.S. and Europe is due to the higher sensitivity of the ERP to the savings rate in Europe. To see the numbers in Table 2 in perspective, European equities should deliver almost 1% higher cash yields into the future to be fairly priced (in an environment of negative yields!)
Read the complete paper and download tools after registration…

Read the full paper and download tools:

  • Buy-and-hold and risk-adjusted return forecasts for 16 key assets over 15 years
  • In-depth analysis of trends and their impact on asset returns
  • Description of cross-asset pricing methodology
  • Sample data spreadsheet for sensitivity analysis – European equities and sovereign bonds
  • Historical over- and under-valuation data

Data Protection Commitment

LINKS Analytics will not distribute your personal data to third parties – no exceptions made. Upon your first request we will remove your data from our database.

Learning From Ninety Years of Recessions: Signs of a New One.

“It took me 30 years to understand that returns are calculated incorrectly. It is always assumed that you survive large events.” Nassim Taleb
As events go, economic crises are the big ones. What makes recessions particularly damaging is our misconceptions about them: there is remarkable lack of agreement among economists and investors about the reasons and anatomy of crises. The biggest culprit is of course our inability to differentiate between the cause, the effect and a coincidence.
In this overview, we use our usual toolkit of supply networks and impact transmissions using our in-house system – LINKS Mira. Our starting point was the NBER United States recessions data – a monthly time series since 1854 where 1 stands for recession and 0 stands for no recession. The NBER recession takes account of a number of monthly indicators—such as employment, personal income, and industrial production as well as quarterly GDP growth. In the end, this too is an arbitrary concept, but the best we have to work with. Since data quality and availability prior to the Great Depression are suspect, we begin the study with the 1929-33 events.
An interesting pattern emerges: all documented crises can be traced back to a significant event that is external to the economic system – usually a major shift in technology (to the extent that technology can be external) or government policy. The external event changes the competitive balance in parts of the supply network. The imbalance grows slowly and after reaching a tipping point where the status quo is not sustainable any longer, explodes and spreads to the adjacent industries.

Network data for recessions

Carry out your own research on recessions data.

Technology shifts in multiple industries were responsible for the Great Depression, the IT bubble and the sub-prime crisis. But by far the most frequent causes of a recession have been regulatory and geopolitical: cutting government appropriations in 1946, introducing accelerated depreciation in 1954, US oil embargo in 1973 – have all caused significant recessions.
This pattern is remarkably similar to what we have today. A large technological shift in the oil industry – the advent of shale oil, creates a temporary glut in the market forcing oil and other commodity prices to shift. This creates change in behaviour: companies assuming low energy prices in the future invest in energy-intensive technologies. At present we are in the phase of multiple tipping points: shale oil and oil services companies cannot operate because of limited capital and cost issues, petrochemical and utility companies have committed significant resources to oil and gas-related projects and oil majors have cut capital expenditure. In this environment it may only take a minor weather-related change in demand to trigger a another event.
Explore the causes and pathways of all ten recessions here.

90 Years of Recessions

Explore the causes and spreading of each of the ten recessions since the Great Depression.

Dissecting the Risk of EM Sovereign Bonds

In a negative yield environment of present days the high single-digit dollar yield of emerging market sovereign bonds is indicative in itself: few believe that the principal will be repaid as debt levels are anything but sustainable. Even before the maturity, any global liquidity event could render these bonds worthless. However for a selective investor the asset class may offer a very interesting yield opportunity with limited debt sustainability and contagion risks.
There have always been plenty of wrong reasons to invest in the financial instruments issued in a collection of countries inappropriately termed emerging markets. To be clear from the onset, these countries have very little in common that would warrant bundling them together, and what is more important, as a group they are not emerging anywhere. Yet, there is at least one good reason to invest in sovereign bonds issued by some of these countries at present – reasonable yields at limited incremental risk. 
What we call reasonable yield is close to 7% for dollar-denominated sovereign paper rated BB and below. Few would argue against the reasonableness of that level given the present environment of negative yields in Europe. A somewhat more difficult argument needs to be constructed to support the assertion of limited added risk. This issue of risk wire expands on the real and perceived risks of investing in dollar-denominated EM sovereign bonds and proposes a controlled implementation process with a custom benchmark. The custom benchmark achieves a level of risk-return combination that is appealing, something that the standard benchmark fails at, particularly once we take into account all aspects of risk.
Key to our argument for limited incremental risk is that past EM crises have one way or another been induced by rising USD interest rates and unsustainable debt levels. In our earlier issues of Risk Wire this year it was demonstrated that yields were very unlikely to rise any time in the foreseeable future.
We get the first hint of the attractiveness of the asset class while comparing valuation/pricing risk across asset classes – the Graham Risk levels (Figure 1). The GR level of -2.7% for EM USD bonds means that there is at least that much yield cushion: given the current macroeconomic risk in these markets the fair compensation for risks is ~4.3% yield instead of the 7%. In other words, an investor in these bonds is overcompensated for the risks.

The Cost of American Industrial Revival

For a number of years investors have been used to the Unites States economy providing almost all of the global growth impetus and serving as a shelter in times of distress in Europe and the Emerging Markets. Abundant capital investment in traditional industries, prompted by low energy prices and the eroding competitive position of China, has triggered a form of U.S. industrial revival. We argue that this revival is temporary and will be followed by painful readjustment, and once again, much like in 2007, the U.S. market will become riskier than the rest of the world.
Cheap natural gas and oil prices in the U.S. combined with rising wages in China heralded the industrial rebirth in the United States during the last few years. Investment in fixed capital, which had collapsed during the great recession, recovered to more sustainable average cross-cycle levels by 2011. What was curious about this recovery, however, was the composition of industries contributing to the net additions to capital stock. While increases in investments in the services industries were still lower than the average over the previous decade, investments in traditional capital and energyintensive industries recovered sharply (Figure 2). Industries like textile, metal fabrication, wood, leather, construction saw fixed asset investments grow at a rate of more than 15% over the decade average, while traditionally growing capex industries saw their investment numbers below average, albeit still significant contributors to the capex growth.

Risk Wire 2016-1: Outdated Expectations in a Changing World

Advances in automation accelerate the trend started by the globalization – higher total factor productivity and GDP growth combined with low incomes and unemployment. As it turns out, our return expectations are not aligned with these realities of today.
Return assumptions for the largest and most liquid asset classes are the key inputs in any asset allocation exercise and consequently pretty much determine the outcomes. The fact that these assumptions are critical and should be carefully examined is now fully acknowledged. It is also understood that these assumptions should be consistent. But consistent with what? The usually taken path is to build expectations consistent with actual history: average historical P/Es and mean reversal assumptions, for instance, can be a basis for calculating expected equity returns. Average yields over the last ten years could help build expectations about the yield levels in the future.
Historical consistency, however, comes at a price. What if historically consistent returns are inconsistent with today’s facts? This is very much the situation we find ourselves today. There have been expectations of rising yields for years now – expectations that have to date caused downfall of illustrious careers. However, yields have remained stubbornly low, even continued to decline. Margins and returns on capital in the U.S. are uncharacteristically and stubbornly high, but so is the unemployment rate (by historic standards at any rate). Making sense out of all this requires consistency not with history, but with today’s realities: the world has changed (as it always does) and expectations should change with it.
One such expectation is higher interest rates – the ever unsuccessful attempt to find that elusive “normal” level of rates. We demonstrate how (and why) yields may continue to fall and sustain even negative levels for a considerably long period of time. Our point of departure is the Graham Risk framework – the cross-asset valuation and risk framework used by LINKS (a complete description and a sample interactive spreadsheet available here).

LINKS Graham Risk Methodology

LINKS Graham Risk based return forecast for European equities and bonds including a complete working model in Excel.

Oil Fatigue: Never Strong Again?

The US economy, in its permanent quest to achieve energy independence, has driven itself into yet another unsustainable state. Counterintuitively, allocating to commodity and oil exporting emerging market equities and debt might just prove to be the winning strategy going forward.
So much of the present investment policy status quo depends on the commodity prices that the implicit assumptions about the current doldrums in the commodity markets continuing for longer period affects long-term asset allocation. Among other things, this assumption has an impact on equity allocation to the emerging markets, high-yield credit allocation in the US, alternatives, infrastructure – you name it, it all depends on what one believes about the commodities, and particularly the oil price.
In our 2011 Global Systemic Risks review we wrote: “…despite higher production (non-OPEC countries) spare capacity in OPEC countries and falling consumption by non-OECD countries the oil price continues to go up. We explain this by the significant impact of the long positions in oil by financial institutions. A further slowdown in the global economy and oil demand will shift the long interest into short interest and cause large price swings. This will dampen the appetite of institutional investors and cause a period of very low oil prices ($20-40 per barrel).”.At the time of course the $ 20-40 range was career-threateningly far from the current price and the anchoring level. That range was eventually breached, partly due to the reasons we expected, and partly due to things that at the time were hard to predict. The drastic change in the oil price level shifted a number of dependencies in the global economy. In this issue of the Risk Wire we assess the supply chain impact of the current low oil prices on the US economy and propose reasons for the unsustainable low-price regime.
Download the paper

Deflation Across Industries

Falling prices of commodities have been passed through the supply chains to most industries with varying effects. Industries that are more consolidated and manage to keep the output prices stable enjoy higher margins, whereas more fragmented industries see output prices falling quicker than raw material prices. The overall picture is unfortunately negative for equities and equity-linked asset classes.