Risk Wire: The Fragile Exposure to Technology

Much has been discussed about the technology sector concentration of S&P 500. Although we find that the degree of concentration is not unusual, once certain myths about the largest companies are dispelled, the nature of exposure and corresponding end-market risks indicate a degree of fragility.
The concentration of the US stock market performance in the technology sector has been source for concern in the last few years. The variedly used FAAMG or FAANG acronym (alternating inclusion of either Microsoft or Netflix along with Facebook, Amazon, Apple and Google/Alphabet) has successfully taken its place next to the old favourites, such as BRICS or PIGS.
Much like the latter two sets of countries, the companies in question have more differences than commonalities and it is the underlying markets that drive the risk profile rather than the companies themselves: fortunes of Google and Microsoft are as aligned as the future performance of Brazil and India. Although there are common drivers, the specific risks are driven by underlying end-market exposures. In this issue of Risk Wire we attempt to zero in on the ultimate sources of risk with respect to the leading technology platforms, dispelling some myths on the way.
To be clear, this is not analysis of the technology sector investments in general. Rather, we attempt to evaluate the exposure of the market to the five leading companies and the underlying risks that exposure implies.

Run Economic and Geo-political Scenarios

Explore how Agent-Based Models (ABMs) can be used to run stress tests and scenario analyses.

Investing in the Age of Disruption

The emerging disruptive forces of technological, political and demographic change threaten to destabilise long-term investment performance. It will take special kind of capacity building and flexibility for institutional investors to benefit from disruption rather than fall prey of it.

We live in an age of unprecedented confluence of multiple disruptions. First, there is a generation of twenty-somethings set on disrupting virtually every industry using technology that did not exist or was too expensive a few years back, some of them succeeding in the process. Then there is the macroeconomic disruption brought by ageing population, stagnant productivity. There is the political disruption of Trump, Brexit and all the rest of isolationist and populist tendencies – evidence suggests that reversal of globalisation is progressing fast. Of course, the environmental disruption is hard to ignore. These trends happen very quickly in the historical context and reinforce each other.
What is the implication for the investment policy, if any? In the first issue of the Risk Wire this year, we attempt to take stock of all these disruptive trends and draw some conclusions in terms of the appropriate policy response.

Run Economic and Geo-political Scenarios

Explore how Agent-Based Models (ABMs) can be used to run stress tests and scenario analyses.

End of Oil Greatly Exaggerated

Of all the global risk sources at the tail end of 2017, a sudden oil price shock arguably poses the greatest risk to institutional portfolios both in terms of its likelihood and the severity of impact. But perhaps the most troublesome factor is the complacency or lack of attention towards this risk; if anything, investors’ concern is over sharply lower oil prices.

The reasons for complacency could be traced to the widespread belief that the days of significance of oil as key commodity are numbered, and that we have already seen the beginning of marginalization of oil as energy source. The reality cannot be farther from the truth:

  • the world is using more oil than ever before,
  • electrification of transport will not matter at least until 2025,
  • traditional oil producers have underinvested,
  • shale oil producers face limits to productivity gains.

All of the above prompted us to carry out a 75% price hike scenario analysis using LINKS Mira ABM. Our conclusion is that the resulting environment will be toxic for fixed income instruments due to the inflationary pressure, but there will be bright spots to hedge with.

Run Economic and Geo-political Scenarios

Explore how Agent-Based Models (ABMs) can be used to run stress tests and scenario analyses.

Risk Wire: Is Global Reflation Sustainable?

The global reflation trade has been in the centre of investor attention lately. One-off factors such as Brexit, commodity price increases due to government policy in China and oil price that rebounded from low levels, could explain much of this reflation. We audit the “trail” of reflation sources and identify a key vulnerability in the reflation narrative. We also introduce two risk scenarios in Mira ABM related to reflation: i) Disorderly Collapse of China’s Economy and ii) Collapse of Oil Price.

There is a modest global reflation unfolding in the last few quarters that has been hailed by investors and regulators as a welcome sign of economic normalisation. Should this process be sustained, it is fair to assume that the long-term interest rates will go back to their historical average values, thus putting an end to the era of financial repression.
Before getting too excited, we checked the source and sustainability of this reflation. Under normal circumstances, reflation is a reliable sign of improving economic outlook and earnings. In this issue of Risk Wire, we try to identify the sources of reflation in so far as positive earnings dynamics are concerned. We zero in on a key weakness of the reflation narrative and develop two “contrarian” scenarios for LINKS Mira ABM: “Disorderly Collapse of the Chinese Economy” and
“Oil Price Collapse”.

Run Economic and Geo-political Scenarios

Explore how Agent-Based Models (ABMs) can be used to run stress tests and scenario analyses.

Risk Wire: Quantifying the Headlines From Trump to Brexit

Is media coverage of potential sources of economic disasters proportionate to their likely impact on the economy and institutional portfolios? Investors form their perception of the magnitude of risk based on large number of public sources. Political biases, different estimation approaches and assumptions may result in unfair attention to things that do not matter and lack of attention to significant risks. We use Mira ABM to evaluate the impact of two widely covered global geopolitical risks with surprising results.

In this issue of Risk Wire we introduce two global risk scenarios:
i. Advancement of populist economic policies in the USA
ii. Hard Brexit
In contrast with our earlier work, these risk scenarios do not originate in our frameworks. Instead, we opted for collecting key generic global risks that attract the most attention in the investment community. We introduced these risks in Mira ABM* and found that despite their headline-grabbing nature, geopolitical scenarios appear to have no meaningful impact on a typical pension fund portfolio at least in the time frame of up to three years. Figure 1 represents a comparison of these two scenarios with two economically-driven scenarios covered by LINKS.

Run Economic and Geo-political Scenarios

Explore how Agent-Based Models (ABMs) can be used to run stress tests and scenario analyses.

Risk Scenario: China Disorderly Economic Collapse

Why is The Scenario Risky?

The second largest economy in the world, with reported debt-to-GDP rate of 240% to 280% and a far greater ratio, if shadow banking is taken into account (source: Bloomberg, World Bank), must be a source for concern. More worryingly, the pace of debt build-up is among the fastest in the world: average annual credit growth rate of 20% between 2009 and 2015 was accompanies by GDP growth rate of only 6-7%. “Out of 43 economies where credit-to-GDP ratio increased by more than 30 percentage points within five years, 38 economies subsequently experienced severe disruptions, manifested in financial crises, growth slowdowns, or both.” China’s credit-to-GDP ratio increased by nearly 50%. As long-term risks are too high to bear in the corporate debt market, companies are resorting to short-term funding. The average weight of debt maturing in less than 12 months in total debt among 1020 largest state-owned enterprises (SOEs) is at 66%.

Where Does the Risk Come From?

Debt is not just a result of overly ambitious growth appetite; China’s SOEs have been operating at economic losses for decades – losses that had to be financed somehow.Average Returns on Capital (ROCs) at state-owned enterprises are at 4.5 %. Real market cost of capital is a weighted average of 4-6% on wealth management product yields (the “unregulated level of return”) and cost of equity of 8-10%, i.e. the real cost of funds is near 8%. This means on a $100 investment an average Chinese SOE makes $4-6 and pays $8 as interest, generating a loss of $2-4. Increasing volumes of investment only increase the losses and debt. Only 1 out of 17 SOEs in the CSI index earns more than 8% on capital invested. Cutting investment is not an option due to the political fallback – resulting unemployment and social unrest will be difficult to handle.

The Not So Obvious

Large part of key industries’ balance sheets are supported by property and infrastructure prices. Property prices are supported by more credit. If this demand wanes, balance sheets of companies will look even worse than they are now. Balance sheets of banks are funded by the off-balance-sheet Wealth Management Products (WMPs) – investment instruments sold to clients with implicit guarantee by the bank. Money raised is then used to buy (among other investments) corporate bonds, proceeds of which are used to pay back balance-sheet debt. The mechanism moves debt off the banks’ balance sheets.

The Initial Impact

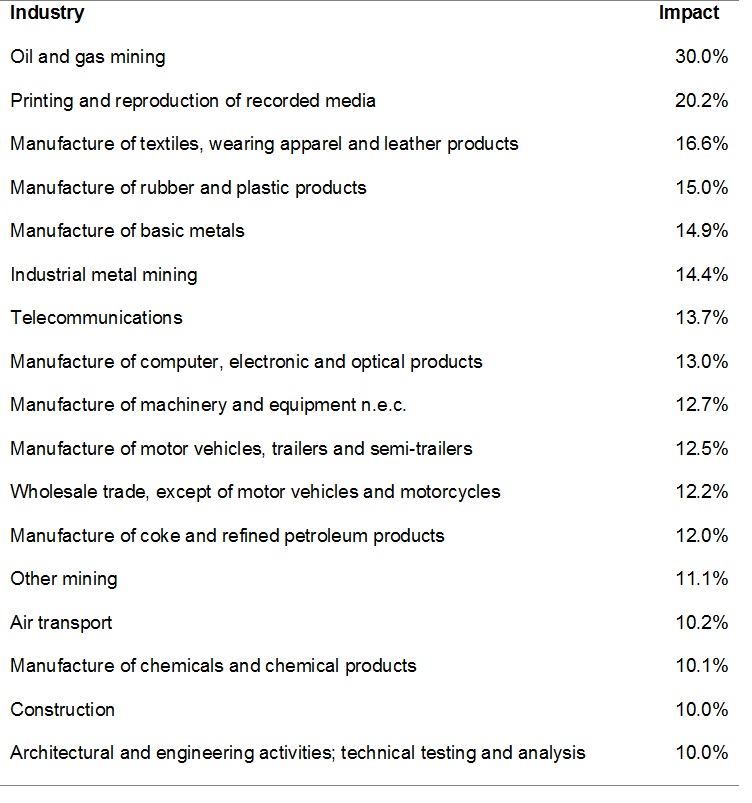
Most debt is accumulated in Local Government Finance Vehicles (LGFV’s) and SOE’s, in turn held by banks and structured in WMPs. SOE’s ability to maintain certain level of interest payment is key, which in turn depends on their profitability.Actual interest paid is a bad measure: debt is often rolled over with interest payments capitalized. Many SOEs in reality do not pay interest because they cannot afford to. To determine the industries that are likely to collapse first, we use ROC and size cut-offs. We focus on the least profitable and largest SOEs in China. The scenario assumes a decline in revenues (driven by volumes) of between 10% and 30% – proportional to ROCs and consistent with historical recessions.

The Contagion Effect

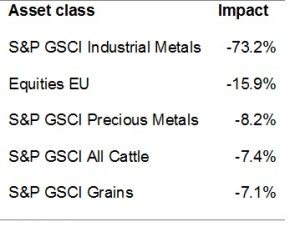
Worst impacted assets are industrial metals at over 70% downside, followed by equities in Europe at nearly 16%.

Safe Assets

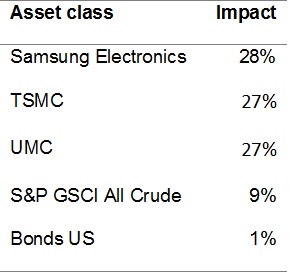
Clearly, US Treasuries are a safe asset to hold in such an event; even though China holds significant reserves of US Treasuries, the demand for Treasuries in this scenario will outweigh the selling pressure from China. A more aggressive hedge against the scenario is a position in electronics and semiconductors manufacturers in Taiwan and Korea. Based on the supply chain analysis LINKS Mira indicates a strong negative relationship between the heavy industries that are part of the weak SEO scenario and advanced electronics and semiconductors: the resulting lower prices for industrial and precious metals are positive for electronics, while the Chinese and global demand for electronics will fall to a lesser extent.
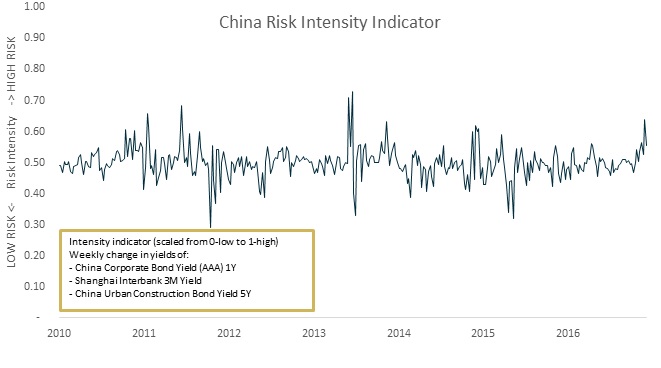
Intensity

Financial risk resides in the bond market, which is observable. The intensity indicator is based on weekly change in yields of three indices representing industrial, interbank and construction markets, with a high risk intensity corresponding with 100 basis point shift in yields in a week – a significant stress in a system.

  • Component 1: China Corporate AAA Bond 1Y yield
  • Component 2: Shanghai Interbank 3M yield
  • Component 3: China Urban Construction Bond 5Y yield

Run Economic and Geo-political Scenarios

Explore how Agent-Based Models (ABMs) can be used to run stress tests and scenario analyses.

How We Tested "The Trump" With Mira

We extend LINKS Mira to the analysis at a portfolio and asset class levels. Mira enables us to value asset classes and carry out scenario analyses, such as the “Trump-effect”, presented in this issue. To establish credibility of the approach LINKS have consistently taken over the years, we also review the results of our documented recommendations over the 2012 – 2016 period as published in earlier issues of Risk Wire.

The common weakness of conventional stress testing and scenario analysis is their reliance on historical statistical relationships and the assumption of “other things being unchanged”. Unfortunately, in real life there is interactivity between agents, and hence the assumption of “other things being unchanged” often renders analyses futile.
Infrastructure spending is a case in point. Increasing volumes of infrastructure spending, other things unchanged, can result in larger profits in the economy. However, higher demand for workers will put pressure on wages in similar industries (e.g. mining) and result in shrinking profits elsewhere. The combined effect on the economy will depend on the relative size and structure of the economy as well as the size of the initial change.
An agent based model simulates these relationships and treats the global economy as an integrated network. Mira will pass a change in price and/or volume in one industry (the initial event) along the supply network and estimate the total impact on profits generated by all companies in all countries. To explain this in different terms: any event will impact all other economic agents along the supply chain. The cumulative impact of all these (inter-)related changes for all agents is what LINKS Mira measures.

Putting Economics Back in Economic Scenarios

Rising complexity in the world and structural breaks across markets require new non-stochastic approaches to scenario generation. The world is also too complex for simplistic ad-hoc assessment. We demonstrate the insights gained by implementing a supply chain agent-based model (LINKS Mira) and run the “China hard landing” scenario with curious conclusions.

As the world goes through a significant economic and political transformation, the number and complexity of risks and opportunities for institutional portfolios increase considerably. Gone are the days when the direction of globalization and integration was unquestionable, the question was just the differences in pace.
Increasing complexity creates additional problems for investment management. How does one manage risk and return in an environment where history is no longer a fair guide? Typically, economic scenario analysis and stress testing are the tools of choice. The common approach is statistical: basic models rely on stochastic processes with a random variable drawn from normal distribution, while more complex approaches involve multiple distributions, decomposition into multiple trend patterns and regime switches. A less common approach is designing ad-hoc descriptive scenarios in the context of the growth-inflation framework. Both approaches fail to deliver actionable results.

The State of the Growth Engine

Contradictory macro- and microeconomic observations in today’s economy are a norm, and the recent earnings season in the U.S. only adds to the uncertainty. Unfortunately, wishful thinking is not a way out this time either: putting the pieces of puzzle together reveals the state of economy that is not new.
One of the biggest challenges of having a consistent asset return framework is trying to reconcile the assumptions, inputs and returns with the myriad of macro- and microeconomic observations. Often contradictory observations peacefully coexist in the global economy, raising alarms and questions. In this issue of Risk Wire we have tried to take an inventory of key observations (contradictory or not) and tie them together in the context of the Graham Risk framework.
The first observation – the actions of the Central Banks, are clearly the focus of the investment community, with ECB, the Fed and BoE extending unconventional policies. Acronyms like ZIRP and NIRP have become the favourite in the community, as many veteran investors have launched critical attacks of the central bankers. One of the most unrestrained attacks by Bill Gross appeared in an article on October 5, 2016:
“Central bankers have fostered a casino like atmosphere where savers/investors are presented with a Hobson’s Choice, or perhaps a more damaging Sophie’s Choice of participating (or not) in markets previously beyond prior imagination. Investors/savers are now scrappin’ like mongrel dogs for tidbits of return at the zero bound. This cannot end well.”
The second observation, which is hard to reconcile with the first one, is the strong earnings season in the third quarter of this year. Although the season is not over yet, so far a double-digit recovery in earnings is at hand, which is the first positive sign since the late 2014 that corporate America is back to health. Our third observation – higher oil and other main commodity prices can be easily reconciled with stronger earnings season, and with stronger labour market – the fourth observation.
All of the above, however, cannot coexist in an environment of overcapacity in most industries, falling prices for agricultural commodities and the generally deflationary environment. The cocktail of these observations is so inconsistent that a “deeper dive” is warranted in multiple asset categories, geographies and sectors to untangle the web of dependencies.

While earnings numbers are driven by many one-offs and cost adjustments, the revenue numbers are more indicative of what the current state of the economy is. S&P 500 sales are still to recover to the 2014 levels. Large part of the recovery is due to the rebounding oil and materials prices; however, revenues of the energy sector are still down 42% since the peak a few years ago. Materials sector revenues are down 17% and given their combined effect on the industrials sector is large enough to limit growth there, the lacklustre revenue performance of S&P 500 since 2014 is no surprise.

Read the complete paper and download tools after registration…

Read the full paper and download tools:

  • Buy-and-hold and risk-adjusted return forecasts for 16 key assets over 15 years
  • In-depth analysis of trends and their impact on asset returns
  • Description of cross-asset pricing methodology
  • Sample data spreadsheet for sensitivity analysis – European equities and sovereign bonds
  • Historical over- and under-valuation data

Data Protection Commitment

LINKS Analytics will not distribute your personal data to third parties – no exceptions made. Upon your first request we will remove your data from our database.

Counterparty Risk: When CDS Spreads and Ratings Are Not Enough

As the recent Deutsche Bank episode illustrates, counterparty risk management for pension funds and insurance companies should be based on more proactive and comprehensive assessment of all risks relating to the counterparty. Many Boards and investment committees, undoubtedly, have revisited their exposure to Deutsche Bank at some point during the episode and have had to make a quick decision (one way or another) based on limited amount of information. Such a decision would have been made easier with information beyond credit ratings, CDS spreads and rumours.
The situation is of course more complex than a few numbers can suggest: on the one hand, most major counterparty banks have extremely complex balance sheets, with off-balance-sheet exposures significantly more important than what is on the balance sheet. Based on our assessment of major counterparty banks, on the average, assets recorded on the balance sheet are only 65% of all assets that can be traced to the banks. This is possible through the use of special vehicles (SIV, SPE, VIE etc.). Furthermore, due to the so-called Master Netting Agreements, only a small proportion (~ 0.05%) of the total notional value of derivatives is actually included in the balance sheet. All of this creates huge uncertainty, which is not resolved by the politicized and commercial nature of credit ratings.
On the other hand, many banks, and not least Deutsche Bank, constitute a systemically important part of the global financial flows and as such will not only attract greater scrutiny from the regulators but also greater willingness to bail out in case of distress. Certainly the ability and willingness of the government to bail out banks has an implication for the credit risk. But not all home-governments are equally well-off to be able to afford such a rescue. So how does one reconcile all of these factors when dynamically assessing limits to counterparty exposures? Just how risky was the Deutsche Bank episode and what can be done to manage the risks in the future?

To take the example of Deutsche Bank, assessing the extent of the risk as the news flow arrived would have been easier with the insight of what is not on the bank’s balance sheet. Along with all the other major investment banks, Deutsche Bank has a significant derivatives exposure. Based on their 2015 annual report, the notional value of these derivatives is a little below Eur 42 trillion. Large part of this exposure (Eur 32.9 trillion) is in interest rate swaps. To be clear, the bank’s economic exposure is a fraction of this value – only about Eur 20 billion, or about 0.06%. A non-event then?
Not quite. The intricate mechanism of cash (or equivalent) collateral is in place to manage the counterparty risk of all the parties involved. One side of a trade in such a case is usually a pension fund or insurance company hedging its liabilities, while the other side – a hedge fund or bank. When for whatever reason there is distress in the market, such as the one we saw for Deutsche Bank (DB), trades that are unwound in one direction (in case of DB reportedly by a number of hedge funds) are likely to create quite a bit larger open exposure. What is more troubling, if interest rates begin to climb, as they do in these circumstances, there will be a large need for cash collateral from the side that gains, while the side that loses might fail to deliver the required collateral, thus exposing DB.
Judging by unaffected EONIA and LIBOR spreads, however, there is still little cause for panic. A number of factors help mitigate the specific risk. First, Deutsche Bank happens to be in the second group of G-SIB banks (Global Systemically Important Banks), a list that explicitly flags to the governments which banks cannot be left to sort themselves out. Second, the sustainability gap of Germany’s debt is a positive 1.5% (source: LINKS Counterparty Risk Assessment) – one of the few governments able to arrest any negative development, although the size of the (hypothetical) rescue is a whopping 5.3% of GDP.
Having these numbers at hand makes discussion on active management of counterparty risks more tangible and productive; as always, being prepared is the first line of defence.

Counterparty Risk

Find out more about LINKS Counterparty Risk Assessment data: comprehensive, flexible, cost-effective.