
The conventional wisdom suggests that pension funds have ample liquidity, and therefore can use it to harvest illiquidity premium – excess return due to low liquidity. But while measuring the available excess return by asset class is relatively easy, it is much harder to assess whether that excess return adequately compensates the fund for giving up liquidity. As it happens, the required compensation for giving up liquidity is sufficiently high to rethink asset allocation.
For some time now LINKS have been advocating a more structured and thorough approach to liquidity management at pension funds at the portfolio construction phase. Presently, liquidity is managed at best by holding a certain proportion of the portfolio in the most liquid government paper. Ontario Teachers’ Pension Plan (OTPP) describes the liquidity management with one sentence: “We manage the risk of not having sufficient cash on hand to meet current payments to plan members by holding at least 1.25% of the plan’s assets in unencumbered Canadian treasury bills”. At worst, liquidity management is left to treasury/accounting.
This attitude is not surprising, given the perceived ample liquidity that pension funds possess. Yet, with changes in banking regulation that make long duration assets more expensive, banks turn more and more to pension funds for liquidity provision. Moreover, most asset classes have sub-categories that are less liquid, but promise higher return, such as emerging and frontier markets in equities or high-yield or mortgage-backed securities in the fixed income universe. The question is: just how much excess liquidity does a pension fund have and how much should it be compensated for giving it up? In other words, what is a hurdle rate of liquidity?
To be clear, the answer to this question does not entail estimating the liquidity risk premiums for different asset classes. These estimates are broadly available for most assets however by themselves they do not answer the posed question. Is 1.5% liquidity risk premium of infrastructure investments sufficient to compensate pension funds for locking their cash?
Category: Publications
Is Demographics a Threat to Equity Returns?

The U.S. equities by all standards and measures are not dear: both the supply side in terms of sustainable ROEs and the demand side in terms of savings, leverage and inflation shocks are supportive of the current pricing. It is, however, hard to ignore the potential impact of demographics.
A number of years ago the first place we looked to try and explain the historical levels of equity risk premium was demographics. The choice seemed natural at the time: the greater the proportion of older people, the greater the risk aversion and preference for fixed income investments. Despite months of empirical work, however, we failed to find any reliable relationship between the various demographic factors and equity risk premia. LINKS then went on to base the ERP studies on the factors that did exhibit strong empirical relevance: savings rate, leverage and inflation surprises.
As it happens, we did not rid ourselves of the need to think about demographics. As summer of 2015 approaches and the S&P 500 has added a whopping 140% since the low level in 2008 (Figure 1), the question of whether the valuations have become unsustainably high still depends on our understanding of demographics. More specifically, it depends on the elusive link between aging and the savings rate. After all, historically low levels of volatility are yet another reminder of the danger of complacency: the degree of integration of the pro-cyclical nature of volatility with the investment processes of principal investors today is even greater than in 2008.
Download the paper
Global Systemic Risks Review

This year’s Global Systemic Risks review is transitional. Driven by the advent of the social media, tools and technologies involved in network analysis are among the fastest developing fields in information technology. We believe that this year’s report is in a transition phase between discrete annual research that we used to carry out in the past few years and a continuous, powerful and flexible network research framework that will take its place in the near future.
Download Global Systemic Risks Review 2014
Download Global Systemic Risks Review 2013
Download Global Systemic Risks Review 2012
Global Systemic Risks 2013 Review
It appears that asset bubbles have become the most potent instrument in the hands of the governments in their efforts to generate the elusive growth rates, and not just in the developed economies. The overriding theme of this year’s Global Systemic Risks review is the government policies that trigger, and in many cases foster, asset bubbles – self-perpetuating price or turnover increases in parts of the economy that create imbalances elsewhere.
The 2013 review includes two new sources of risk: the extraordinary rise in capital expenditure by global utility companies and the Japanese government debt, along with sources of risk that were covered last year: civil aerospace, the financial system in China and the U.S. farmland. Combined, these asset bubbles add over $ 4 trillion worth of “hot air” to the world economy. But above all, they create unsustainable imbalances in dozens of industries and are likely to cause significant wealth destruction if not timely deflated.
Needless to say, there are plenty of intricate linkages between all the risk sources that in combination serve as scaffolding for the world economy. The same industrial conglomerates supply capital equipment for the utilities, transport and infrastructure projects in China and aircraft engines for the aerospace industry. The same few banks that hold large part of the Japanese government debt or Farm Credit Funding bonds attempt to place parts of the project finance business in the market for the institutional investors. A clear view of these linkages and how they impact the true economic risks of institutional portfolios must be a key component of forward-looking strategic risk management efforts of principal investors.
Introducing Asset Allocation Resilient to Systemic Risks
This white paper briefly examines the current standard asset allocation practice and introduces asset allocation methodology that incorporates Graham and Network Risks. Resilient asset allocation balances ambition to generate returns with the awareness of systemic risks. The results are compared with most common fixed-weight asset mixes as well as asset allocation implied by the risk parity approach.
In the past number of years LINKS have introduced and used network- and value-based risk management frameworks in order to gauge systemic risks inherent in institutional portfolios. Given the multiple layers of legacy asset allocation processes in place, implementation of LINKS risk frameworks has always been an add-on and ad-hoc exercise for institutional investors. However, as the methodology matures, there is more interest in a systematic asset allocation methodology that is based on LINKS risk frameworks.
Download the document
Global Systemic Risks 2012 edition available now
LINKS Global Systemic Risks 2012 edition is now available on the portal. Following a broad and extensive review of multiple supply chains globally, we have now focused our attention on four sources of systemic risks:
- China’s local government debt and infrastructure spending
- The US agriculture and farmland boom
- Unsustainable rates of expansion of aircraft fleet in emerging markets
- The second US technology bubble
Two sources of risk warrant special treatment: the EMU crisis and energy prices. We have thoroughly researched and mapped four key sources of global risk, or “the future bubbles” for the year 2012, complete with over 500 companies, agencies and governments involved, network effects and potential asset losses if any of those bubbles burst.
Download this complementary report.
Introducing Graham Risk
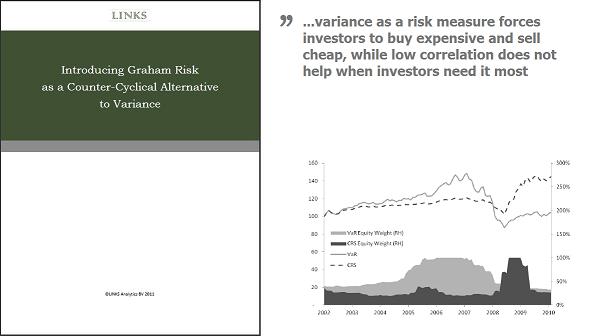
Variance is inversely related to asset returns, which creates a cyclical overexposure to systemic risks. This paper develops the concept of Graham Risk (GR) as a counter-cyclical alternative to variance by introducing short-term imperfect rational expectations of investors.
One of the most damaging financial crises in the recent history of capital markets prompted a major reassessment of risk management theory and practice. Plenty has been written both against and in defense of variance and VaR as a risk measure, however, actual advances in the subject area have been relatively limited. This paper will refer to a selection of well written summaries of key concepts in modern risk management and their criticism. A large part of the paper’s focus, however, will be on entirely new material – a fundamentally new framework to manage risk.
Network Effects & Investor Behavior
The network effect makes the outcome of our decisions and actions uncertain to an extent that the actual outcome could be the opposite of the intended one. The first clearly visible signs of trouble in sub-prime mortgages surfaced in early 2006. Were it not for the network effect, we could isolate the banks with subprime exposure, write down those assets and limit the impact of the event. Instead, the whole system stopped functioning since nobody was certain about the full knock-on effect on the counterparties. The systemic crisis ensued.
Data vs. Knowledge: Economic Relationships & Inattention
The difference between data and knowledge in economics and finance is largely down to the relationships. By introducing relationships between companies and individuals, data points transform into actionable knowledge. While relationships are clearly at heart of economic activity, there is very little effort to incorporate them in the modern investment analysis. There is plenty of empirical evidence of the importance of business relationships and relative inattentiveness of investors.