This white paper briefly examines the current standard asset allocation practice and introduces asset allocation methodology that incorporates Graham and Network Risks. Resilient asset allocation balances ambition to generate returns with the awareness of systemic risks. The results are compared with most common fixed-weight asset mixes as well as asset allocation implied by the risk parity approach.
In the past number of years LINKS have introduced and used network- and value-based risk management frameworks in order to gauge systemic risks inherent in institutional portfolios. Given the multiple layers of legacy asset allocation processes in place, implementation of LINKS risk frameworks has always been an add-on and ad-hoc exercise for institutional investors. However, as the methodology matures, there is more interest in a systematic asset allocation methodology that is based on LINKS risk frameworks.
Download the document
Author: linksweb
Global Systemic Risks 2012 edition available now
LINKS Global Systemic Risks 2012 edition is now available on the portal. Following a broad and extensive review of multiple supply chains globally, we have now focused our attention on four sources of systemic risks:
- China’s local government debt and infrastructure spending
- The US agriculture and farmland boom
- Unsustainable rates of expansion of aircraft fleet in emerging markets
- The second US technology bubble
Two sources of risk warrant special treatment: the EMU crisis and energy prices. We have thoroughly researched and mapped four key sources of global risk, or “the future bubbles” for the year 2012, complete with over 500 companies, agencies and governments involved, network effects and potential asset losses if any of those bubbles burst.
Download this complementary report.
Data- or Analysis-oriented Risk Management?
Modern risk management practice has embraced data with unreserved enthusiasm. Risk management software providers compete based on the number of entries their databases contain. Only recently, one of the prominent firms in the space came out with a white paper on data-oriented systems, vaguely alluding to being “more accurate and precise” in their risk measurements. Incidentally, that firm is the record holder of the number of entries: over three million instruments. Since this number was not sufficient to help their clients survive the 2008 crisis, it would have to be augmented by the three million and first. Or would it?
While computers are very good at holding data in relational databases, they are rubbish at dealing with information. In fact, humans are hugely superior to computers when it comes to holding and manipulating information. Unfortunately, it is neither simple nor easy, and there is no guarantee of control of any sorts. Nevertheless, in the post-variance risk management world it is precisely this ability to work with information and not data that helps us draw conclusions and make decisions about the wild randomness in the markets. So how would we go about designing a risk process based on information?
Running a risk management function without identifying the dominant sources of global risk is akin running a military campaign without having a clue about who the adversary is. Global imbalances, excessive valuations or “bubbles” are a good place to start. This can be carried out on an ad-hoc basis, or methodically. The latter approach using Graham Risk measure is adopted by LINKS Analytics. A typical example of key global risk source is the infrastructure spending in China.
Once the biggest sources of global risk are identified, we can map the transmission pathways to other geographies, sectors and asset classes. The process is as simple as following the economic relationships between parties. A weakness in the Chinese infrastructure sector, for instance, would result in lower demand for materials, such as cold-rolled steel, cement, energy; municipal revenues from land sales will fall, which will put pressure on central government finances, etc. Quantifying these relationships is key to unlocking the potential risks to various asset classes driven by the network effects.
Estimating the impact of risk sources on asset returns is not difficult, since it is the direction of impact that is most informative and not the magnitude. Finally, although there are many imbalances in the global economy at any given point, only few of them pose an immediate threat. Therefore, the level of threat should be assessed dynamically. The ultimate goal of the risk process is to be prepared to implement dynamic hedging strategies or trigger de-risking in parts of the portfolio, should the level of threat be deemed sufficiently different from the past.
While the risk process described in this article is relatively simple and not too data intensive, it requires a risk function that is focused on the external market environment instead of reporting; and information and analysis instead of data. A risk analyst in this setting would require a qualification in business analysis and economics as opposed to SQL and quantitative methods.
Three Reasons for Failing Stress Tests

Sometimes the absurdity of our analytical tools is so obvious that it cannot be spotted without stepping back and having a look at the whole picture. Stress tests as analytical tool are a case in point. On the surface, they seem to complement the standard risk management tools and introduce a degree of “real world” control over the outcome. In practice due to the three major problems in the design of stress tests they end up feeling like one of those primary school math exercises gone wrong: after a long set of calculations you conclude that x = x!
Problem 1: How big a stress?
If we knew beforehand how large the risks are, why would we need stress testing in the first place? It is always possible to come up with a magnitude of stress that can imply an unacceptable level of loss – our limit is the imagination. Since we cannot accurately estimate the likelihood of these scenarios, there is no way of telling which magnitude of stress is the appropriate one. There was an old game: two players think of a number each, the first one tells his number to the second one. The second one then reveals his number, and if it is larger, he wins. Guess who’s the winner in every turn?
Problem 2: What to stress?
Interestingly, this issue pops up in the process of sorting out the Lehman mess. This is a passage from the examiner report in the Chapter 11 proceedings of Lehman: “One of Lehman’s major risk controls was stress testing. …One stress test posited maximum potential losses of $9.4 billion, including $7.4 billion in losses on the previously excluded real estate and private equity positions, and only $2 billion on the previously included trading positions. …But these stress tests were conducted long after these assets had been acquired, and they were never shared with Lehman’s senior management”. Since the scenarios and magnitudes are arbitrary, it is hard to imagine that there were no occasional catastrophic outcomes of analysis. In retrospect, it is always possible to find the scenario which was catastrophic and was not shared with the management.
Often existing bubbles in the global economy can be spotted by the number of IPOs, size of the bonus pool and the opening of dedicated desks by the banks. In many instances, however, this is not the case. While we all know the well publicized imbalances in the economy (China-commodities-trade –Fed etc.), which asset class will be hurt first (or at all) is hard to know. Every crisis in the past hundred years has had unique triggers, mechanisms and consequences. They all had one thing in common – people lost money.
Problem 3: What is the impact?
Last but not least, the most severe problem of all: what is the impact of a stress? A combination of the network effect in action and a complex set of non-linear relationships and tipping points render the whole exercise superficial. Correlations and linear relationships at best describe a world of marginal changes. A stress test, on the other hand, assumes an unusually large change, which by definition triggers unusual reactions.
Introducing Graham Risk
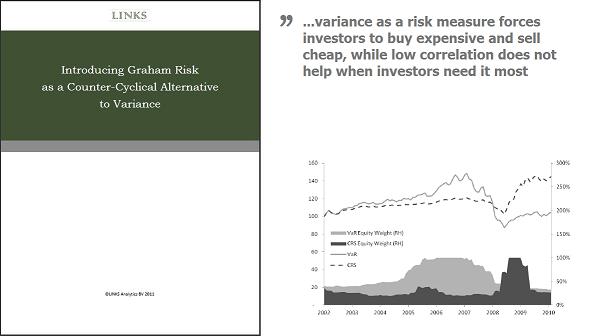
Variance is inversely related to asset returns, which creates a cyclical overexposure to systemic risks. This paper develops the concept of Graham Risk (GR) as a counter-cyclical alternative to variance by introducing short-term imperfect rational expectations of investors.
One of the most damaging financial crises in the recent history of capital markets prompted a major reassessment of risk management theory and practice. Plenty has been written both against and in defense of variance and VaR as a risk measure, however, actual advances in the subject area have been relatively limited. This paper will refer to a selection of well written summaries of key concepts in modern risk management and their criticism. A large part of the paper’s focus, however, will be on entirely new material – a fundamentally new framework to manage risk.
Network Effects & Investor Behavior
The network effect makes the outcome of our decisions and actions uncertain to an extent that the actual outcome could be the opposite of the intended one. The first clearly visible signs of trouble in sub-prime mortgages surfaced in early 2006. Were it not for the network effect, we could isolate the banks with subprime exposure, write down those assets and limit the impact of the event. Instead, the whole system stopped functioning since nobody was certain about the full knock-on effect on the counterparties. The systemic crisis ensued.
Data vs. Knowledge: Economic Relationships & Inattention
The difference between data and knowledge in economics and finance is largely down to the relationships. By introducing relationships between companies and individuals, data points transform into actionable knowledge. While relationships are clearly at heart of economic activity, there is very little effort to incorporate them in the modern investment analysis. There is plenty of empirical evidence of the importance of business relationships and relative inattentiveness of investors.